23 Sales Performance Metrics to Track & Monitor Your Team
Table of Contents
Are you trying to find the gap in your sales performance?
Hah! Then you’re in the right place to find gaps with the help of sales performance metrics to hit your different types of sales goals and gain an edge on the competitive sales arena.
Whether you're evaluating individual salespeople or assessing your entire team, these metrics provide valuable insights into best practices. In today's data-driven business landscape, they serve as your guide, offering direction for productivity and success.
From the time it takes to close deals to conversion rates, these metrics offer a comprehensive view. They enable you to refine your sales engagement strategies and improve sales operations because it's time to redefine success for your business.
So, let's dive deeper into the top 23 sales productivity metrics, including some digital sales averages.
What are sales metrics?
In the world of sales, things can get pretty intricate. You've got strategies, interactions, and results all tangled up together. That's where sales metrics come in.
These metrics are the numbers that give you a clear and detailed view to understand what’s going on in the sales world, helping your business in its growth with the dynamic values of B2C or B2B sales statistics. They help you understand everything, from how you're finding leads to how many customers you're winning over, how well you're closing deals, and how much revenue you're raking in.
Therefore, sales metrics turn all your sales efforts into solid numbers, so you can make smart decisions.
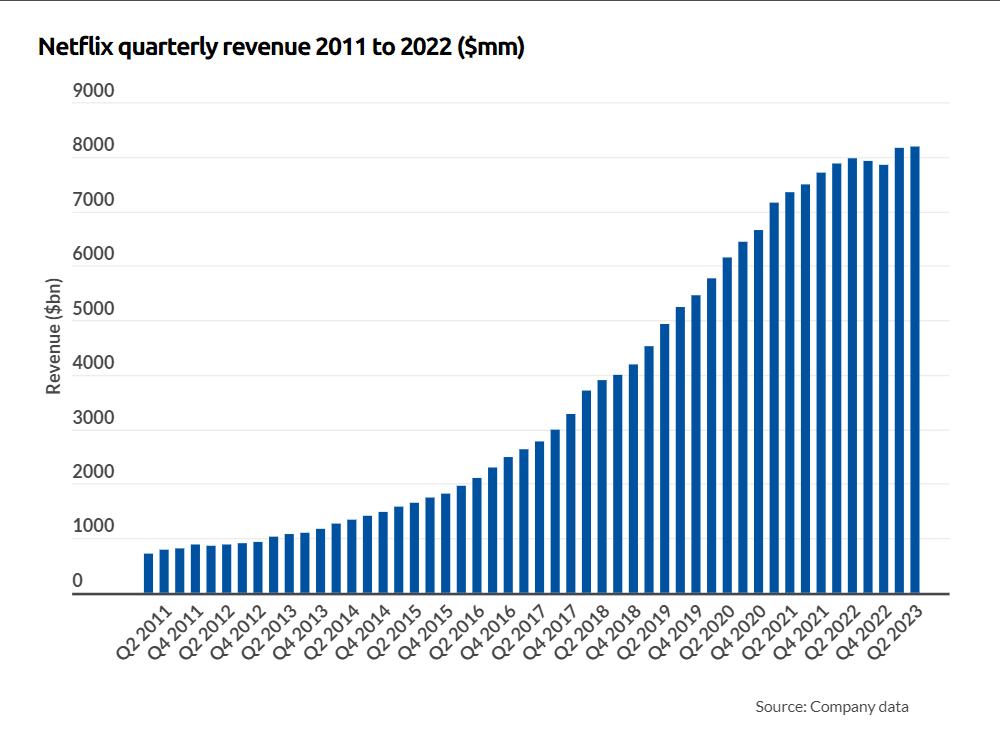
For example, as you can see above Netflix, a renowned global entertainment brand is measuring one of the top sales metrics and that is revenue to count on the ROIs.
Imagine this and all other metrics as the scorecard of your sales performance, displaying your wins, losses, and everything in between. By delving into these metrics, you gain insights into what's working well and what could be improved.
Are your leads turning into opportunities at an optimal rate? Are your efforts generating the expected revenue growth?
Sales metrics answer these questions and provide a roadmap for optimizing your sales strategies.
Why is tracking sales metrics important?
Tracking sales metrics isn’t something you can skip. It’s a must-have tool for any business trying to do well in today’s business world. When you combine these metrics with a well-crafted sales engagement model, they will give you useful insights to nail your sales strategies.
Empowering data-driven decision-making
Sales metrics provide you with concrete, real-world data, eliminating the guesswork and gut feelings. You can make informed decisions based on the evidence right in front of you.
“Spend eighty percent of your time focusing on the opportunities of tomorrow rather than the problems of yesterday” - Brian Tracy.
Strengthening flexibility in the changing business landscape
Sales enablement ecosystems are ever-changing. With metrics in hand, you're agile and ready to adjust your strategies as markets shift, customer preferences evolve, and industry trends emerge. This adaptability keeps your sales team at the forefront.
Sharpening focus on revenue generation
In the task hussle, it's crucial to stay focused on what truly drives revenue. Metrics act as a filter, spotlighting areas with the most significant impact on your bottom line. This precision ensures that your efforts are efficiently channeled, boosting productivity and effectiveness.
What sales performance metrics should your organization track?
Navigating the world of sales metrics might seem like wandering through a maze. There are so many options that you may get confused to prioritize those according to your sales purpose. But fear not!
Let's focus on 23 must-know sales metrics that will be the solid ground to improve your sales performance. These metrics will give you deep insights into every aspect of your sales journey, from first connecting with potential customers to turning them into loyal fans.
Total revenue
Equation: total revenue generated from sales
Total Revenue is like the scoreboard of your sales game, tallying up all the earnings from your efforts.
For instance, imagine your business raked in $100,000 in revenue this year; that's your total revenue. Calculating this metric allows you to see how your business is growing over time, helping you set realistic revenue goals and make decisions on investment and expansion.
Average revenue per account/product/customer
Equation: total revenue / number of accounts or products or customers
Think of average revenue per customer as your magnifying glass on individual relationships. Let's say you're running a gym; if each member contributes $500 annually on average, that's your average revenue per customer.
Understanding this metric helps you identify your most valuable customers and design customized customer retention strategies, potentially leading to higher lifetime customer value and a winning sales engagement process.
Market penetration
Equation: (total customers / total addressable market) × 100
Market penetration is like a roadmap for expanding your empire. Imagine you're in the smartphone business, and you've captured 15% of your projected global market of 200 million users; that's your market penetration.
Using this metric helps you understand your market position and plan for growth, such as finding new opportunities in different areas or among specific demographics.
Percentage of revenue from new vs. existing customers
Equation: (revenue from new customers / total revenue) × 100
This metric dissects your revenue streams, differentiating between earnings from new customers and those from existing ones. Think of this as the balance sheet of your revenue sources. Suppose you run a subscription-based streaming service, and 40% of your revenue comes from new subscribers while 60% comes from existing ones.
By calculating this metric, you'll realize the importance of customer retention. You can then devise strategies to use your current customer engagement to increase sales, which can be more cost-effective than frequently acquiring new ones.
Win rate
Equation: (number of won deals / total number of opportunities) × 100
Imagine your sales team had 100 opportunities last month, and they successfully closed 20 deals. Your win rate for that period would be 20%.
Calculating your win rate helps you analyze your sales team's efficiency. If it's low, you can identify areas for improvement in your sales process and train your team to increase their win rate, ultimately driving more revenue.
Year-over-year growth
Equation: ((current year's metric - previous year's metric) / previous year's metric) × 100
Year-over-year growth showcases the percentage change in a metric from one year to the next, highlighting your business's performance trajectory.
Your company's revenue this year is $1.2 million, compared to $1 million last year. That's a year-over-year growth of 20%. Tracking year-over-year growth is crucial for assessing your business's progress. Positive growth indicates a healthy and expanding operation, while negative growth may signal the need for strategic changes.
Net promoter score (NPS)
Equation: % promoters - % detractors
NPS measures customer loyalty and satisfaction by evaluating the likelihood of customers recommending your product or service.
Scores range from -100 to 100, with higher scores indicating stronger customer advocacy. After surveying your customers, you find that 70% are Promoters (rating 9-10), 20% are Passives (rating 7-8), and 10% are Detractors (rating 0-6). Your NPS is (70% - 10%) = 60.
NPS measures customer loyalty and satisfaction. A high NPS indicates a strong base of happy customers who are likely to refer others, contributing to organic growth.
Lifetime value (LTV) of a customer
Equation: (average purchase value × average purchase frequency) × customer lifespan
Lifetime value estimates the total value a customer brings over their engagement with your company. This is calculated by multiplying the average purchase value, frequency of purchases, and customer lifespan.
For example, if a typical customer spends $500 with your online store each year, and they remain a customer for an average of 5 years, the lifetime value of that customer is $2,500. Knowing the LTV of your customers is vital for making informed decisions about marketing and building relationships for selling. You can allocate resources more effectively, focusing on retaining high-LTV customers.
Quota attainment
Equation: (sales achieved / sales quota) × 100
Quota attainment assesses the proportion of sales achieved against the assigned sales quota. It's calculated by dividing actual sales achieved by the set quota and multiplying by 100. If a salesperson's quarterly quota is $100,000, and they achieve $110,000 in sales, their quota attainment is 110%.
Quota attainment helps you assess the performance of your sales team members. It also identifies who is consistently exceeding their targets, allowing you to reward top performers and provide support to those who need it.
Pipeline coverage
Equation: (pipeline value / sales quota) × 100
Pipeline coverage evaluates the adequacy of your sales pipeline stages in meeting your sales quota. It's determined by dividing the pipeline value by the sales quota and multiplying by 100. If your sales team has $2 million worth of opportunities in the pipeline and your quarterly sales target is $1.5 million, your pipeline coverage is 133%.
Pipeline coverage gives you a clear picture of whether you have enough potential business in the pipeline to meet your sales targets. It helps you avoid revenue shortfalls.
Net revenue retention (NRR)
Equation: ((ending monthly recurring revenue - expansion mrr) / starting monthly recurring revenue) × 100
Net revenue retention assesses the change in recurring revenue from existing customers over a specific period, accounting for churn and upsell. If your recurring revenue from existing customers increased by 10% after accounting for churn and upselling, your NRR is 110%.
NRR shows the health of your customer relationships. A higher NRR indicates strong customer loyalty and ongoing revenue growth.
Repeat customer rate
Equation: (number of repeat customers / total number of customers) × 100
Repeat customer rate quantifies the percentage of customers who make multiple purchases. It indicates customer loyalty and satisfaction. If 30% of your customers make multiple purchases, your repeat customer rate is 30%. Repeat customer rate highlights the effectiveness of your customer retention efforts. Higher rates indicate a loyal customer base.
Conversion rate
Equation: (number of conversions / total number of visitors or leads) × 100
Conversion rate measures the percentage of visitors or leads that complete a desired action, such as making a purchase. If your website received 1,000 visitors, and 50 of them made a purchase, your conversion rate is 5%. Conversion rate measures the effectiveness of your lead generation efforts. Improving this rate means more efficient use of resources.
“In sales, the person asking the questions is in control of the conversation. Great salespeople ask questions to get their buyers talking about what they want and need” - Tom Hopkins.
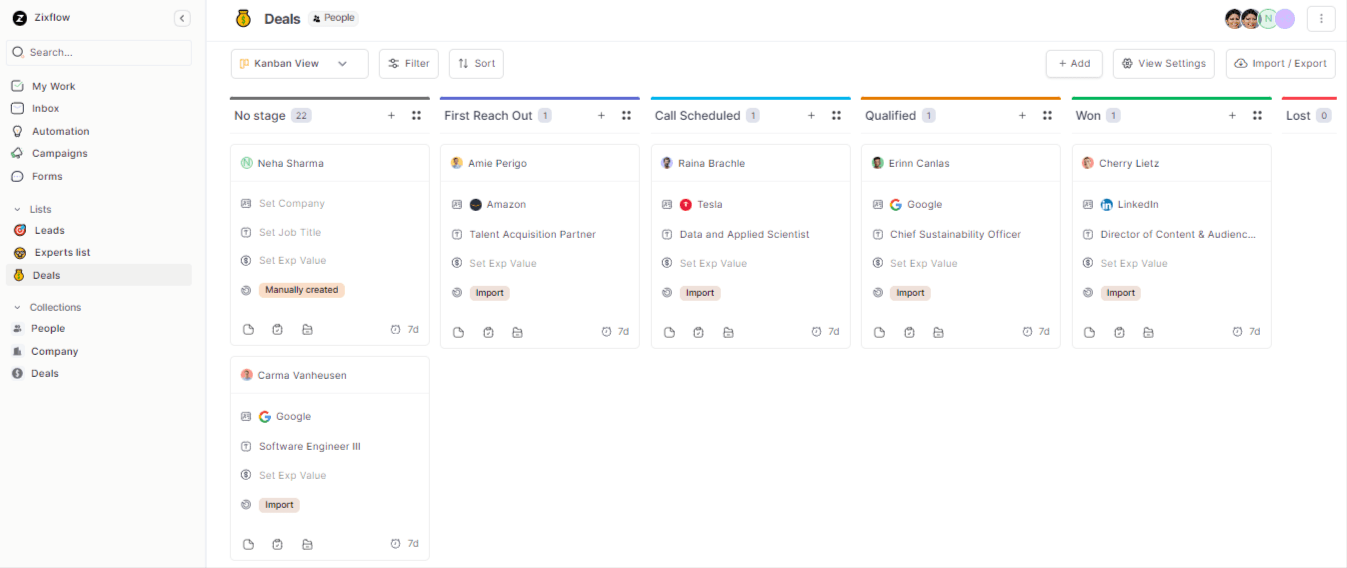
If you're tired of crunching numbers and want to spend more time closing deals, it's time to embrace the best sales CRM tool out there for your sales workflow automation process, and that is Zixflow. Let automation handle the metrics, while you focus on what you do best – sealing the deal.
Sales cycle length
Equation: average time to close a deal
Sales cycle length represents the average time it takes to move a lead from initial contact to closing a deal. If the average time to close a sale is 45 days, your sales cycle length is 45 days. Shortening the sales cycle can improve cash flow and accelerate revenue generation.
Average annual contract value (ACV)
Equation: total annual contract value / number of contracts
ACV calculates the average value of contracts signed annually. If your company signed 10 contracts with a total annual value of $500,000, your ACV is $50,000. Understanding ACV helps with pricing strategies and resource allocation.
Lead conversion rate
Equation: (number of converted leads / total number of leads) × 100
Generating valuable leads is a crucial aspect of your business's success irrespective of size and goals of your business. Luckily there are many lead generation tools available in the market to accelerate your business growth in terms of qualifying for hot leads.
The lead conversion rate shows what portion of generated leads become paying customers. For example, if a marketing campaign generated 100 leads and 10 of them became your customers, your conversion rate is 10%. This metric assesses the lead quality from marketing. A higher rate means better lead quality.
Lead to opportunity conversion rate
Equation: (number of converted opportunities / total number of leads) × 100
This metric evaluates the percentage of leads that transition into qualified sales opportunities.
If 50 of the 200 leads generated from a campaign turned into qualified opportunities, your lead to opportunity conversion rate is 25%. This metric assesses the effectiveness of your lead nurturing process. A higher rate indicates more successful lead progression.
Sales expense ratio
Equation: (total sales expenses / total revenue) × 100
Sales Expense Ratio measures the percentage of total revenue spent on sales activities. It helps you test the efficiency of your sales operations.
If your company spent $50,000 on sales activities and generated $300,000 in revenue, your sales expense ratio is 16.67%. This metric helps you manage costs by evaluating the efficiency of your sales operations. A lower ratio implies better cost management and profitability.
Deal slip rate
Equation: (number of slipped deals / total number of deals) × 100
Deal slip rate measures the percentage of deals forecasted to close within a specific period that get delayed.
If your sales team forecasted 30 deals to close this quarter but 5 were delayed, your deal slip rate is 16.67%. Monitoring the deal slip rate helps identify issues in your sales process so that you can enhance the quality of your sales qualifying questions and further improve forecasting accuracy.
Average deal win time
Equation: total time spent on won deals / number of won deals
Average deal win time reflects the average duration it takes to successfully close a deal. It provides insights into the efficiency of your sales team's efforts.
If it typically takes 30 days to close a sale from the first contact with a lead, your average deal win time is 30 days. Understanding your average deal win time allows you to optimize your sales process. Shortening this time frame means you can close deals faster, potentially increasing revenue.
Sales to marketing ratio
Equation: total sales expenses / total marketing expenses
The sales to marketing ratio compares the investment in sales activities with that in marketing activities. This metric offers insights into the allocation of resources between these crucial functions. If your sales department spends $100,000, and your marketing department spends $50,000, your sales to marketing ratio is 2:1.
This ratio helps you allocate resources between sales and marketing effectively. It ensures a balanced approach to lead generation and conversion. With the help of this metric, you can set clear goals and targets for the team to nail your sales engagement best practices.
Sales forecast accuracy
Equation: ((actual sales - forecasted sales) / forecasted sales) × 100
Sales forecast accuracy measures the alignment between projected and actual sales figures. It indicates the precision of your sales predictions. If your sales team projected $1 million in sales but achieved $900,000, your sales forecast accuracy is 90%.
Accurate sales forecasts are essential for resource allocation and strategic planning. Higher accuracy means better decision-making to utilize your resources from technology to financial aspects strategically.
Call-to-close time
Equation: total time spent on sales calls / number of closed deals
Call-to-close time evaluates the average time spent on sales engagement activities that result in closed deals. It offers insights into the efficiency of your sales interactions. If your sales calls typically take 7 days to result in a closed deal, your call-to-close time is 7 days.
Reducing call-to-close time can lead to more efficient sales cycles and quicker revenue generation.
Enhance your sales potential with Zixflow: start measuring, start excelling!
If you’ve already understood sales performance metrics that must be checked by your smart sales reps, then the next question in your mind is: What’s the next step? Simply optimize those metrics.
And with Zixflow, it's as easy as a few clicks. Want to know how? Here!
- Automate your sales tasks in every bit from targeting an audience to turning them into your loyal leads.
- Connect with your audience around the clock with the help of relevant emails, SMS, or a social channel like WhatsApp to increase sales through social media and nurture your leads.
- Simplify tracking sales metrics and analyzing each of your sales campaigns to calculate every penny of ROI.
- And last but not the least, use this cutting edge sales automation software to win over your competitors while skyrocket your targeted conversion rate.
Now, are you ready to thrive in your business?
Embrace the metrics, watch your sales endeavors soar to new heights and sign up with Zixflow and utilize a pay-as-you-go billing structure that best suits your business needs.
Mousumi Paul
Content Writer