RFM Segmentation: How to Score and Segment Your Customers?
Use RFM segmentation to score customers based on their purchase behavior and group them into meaningful customer segments.
 by Sahil Tyagi

RFM segmentation is a customer analysis method that scores and groups customers on three behavioral dimensions from their own transaction history:
- Recency - how recently they purchased
- Frequency - how often they purchase
- Monetary value - how much they spend in total
Each customer gets a 1 to 5 score on each dimension, and the three digits combine into an RFM score, which places them in a segment such as Champions, Loyal Customers, Potential Loyalists, At-Risk, Hibernating, or Lost.
Building an RFM segmentation model takes five steps
- Define a data window
- Score recency
- Score frequency
- Score monetary value using total spend rather than average order value
- Combine the scores into segments
- Assign a different marketing action to each segment
Well-segmented email outreach generates 760% more revenue than random blasts send you entire audience base. Most e-commerce brands already know that segmentation works, but they don’t know the method for building segments that actually reflect customers’ behavior.
RFM segmentation solves exactly that problem.
It builds customer segments from the three behavioral dimensions that matter most for revenue prediction: recency, frequency, and monetary value. This approach does not require any survey data or building third-party audiences. Just use your own transaction history in such an organized way that it tells you what to do next with every customer in your database.
In a marketing environment where third-party cookies are disappearing and acquisition costs keep rising, first-party data has become the most reliable asset you can have. RFM segmentation is the most practical and widely proven method for turning that first-party data into actionable customer groups.
That's why I'll walk you through what RFM segmentation is, why it outperforms other segmentation approaches, and a method for scoring your customers based on specific marketing actions.
What is RFM segmentation?
RFM segmentation is a customer analysis method that scores and groups customers based on three behavioral dimensions:
- Recency - how recently did they make a purchase?
- Frequency - how often do they purchase?
- Monetary value - how much do they spend in total?
Every customer receives a score for each aspect, typically on a scale of 1 to 5, and those scores are combined into an RFM score that determines which segment the customer belongs to. The resulting segments are behaviorally meaningful because they are derived entirely from actual purchase behavior.
The model was originally developed for direct mail marketing in the 1990s and has since become one of the most widely adopted customer segmentation frameworks across a variety of industries, such as e-commerce, retail, and SaaS.
What makes RFM particularly powerful is that the three dimensions capture different aspects of customer value and customer risk simultaneously. Recency indicates engagement, frequency indicates loyalty, and monetary value indicates spending capacity. Together, the three scores create a multidimensional picture of each customer that a single metric cannot replicate.
Why does RFM segmentation derive better marketing outcomes?
RFM segmentation is not just theoretically sound. It produces measurable improvements in your business metrics that matter most. Here are some of the specific outcomes that follow from building and acting on RFM segments:
Higher revenue per campaign
Unsegmented campaigns send the same message to your most-valued (Champion), at-risk customers, and lapsed customers simultaneously. The message that works for one group is wrong for the other two, which drives down the average conversion rate for the entire marketing campaign.
RFM-segmented campaigns match the message to the behavioral moment. A retained customer receives a VIP offer and a referral request. An at-risk customer receives a win-back incentive. A lapsed customer receives a reactivation message with a high-urgency hook.
For teams measuring campaign performance using different e-commerce metrics, this relevance lift is visible immediately in open rate, click rate, and conversion rate. Also, the revenue impact compounds over time as better-matched messages generate more purchases per send, meaning the same list size produces more total revenue.
Reduced wasted ad spend
One of the most immediate financial benefits of RFM segmentation is the ability to exclude segments from paid campaigns where spend is wasted. Running paid retargeting campaigns to customers with a score of 1-1-1, who have not bought recently, buy infrequently, and have very low total spend, produces negligible return.
On the other hand, running those same campaigns to customers with a score of 5-5-5 produces 2x return on ad spend compared to undifferentiated retargeting.
The exclusion logic is as valuable as the targeting logic. When you stop showing paid ads to churned customers, you free up that budget to spend more on your Champions. This reallocation improves overall ROAS without increasing the total budget.
More accurate customer retention investment
Not all at-risk customers are worth the same cost to retain. A customer with a high monetary score who is starting to show declining recency is worth a significant retention investment. A customer with a very low monetary score who has never bought more than once is unlikely to justify a high-value win-back offer.
RFM segmentation makes this distinction quantifiable. You can identify which at-risk customers have historically high monetary value and prioritize those for your highest-effort retention outreach. This tiered retention approach is more profitable than treating all at-risk customers identically.
Better lookalike audiences for acquisition campaigns
RFM segmentation doesn't only improve retention and lifecycle marketing. It directly improves acquisition campaign performance by giving ad platforms a higher-quality seed audience for lookalike modeling.
When you build a lookalike audience from your entire customer list, you are asking the platform to find people who resemble everyone from your Champions to your churned customers. The resulting audience is broadly similar to your general customer base.
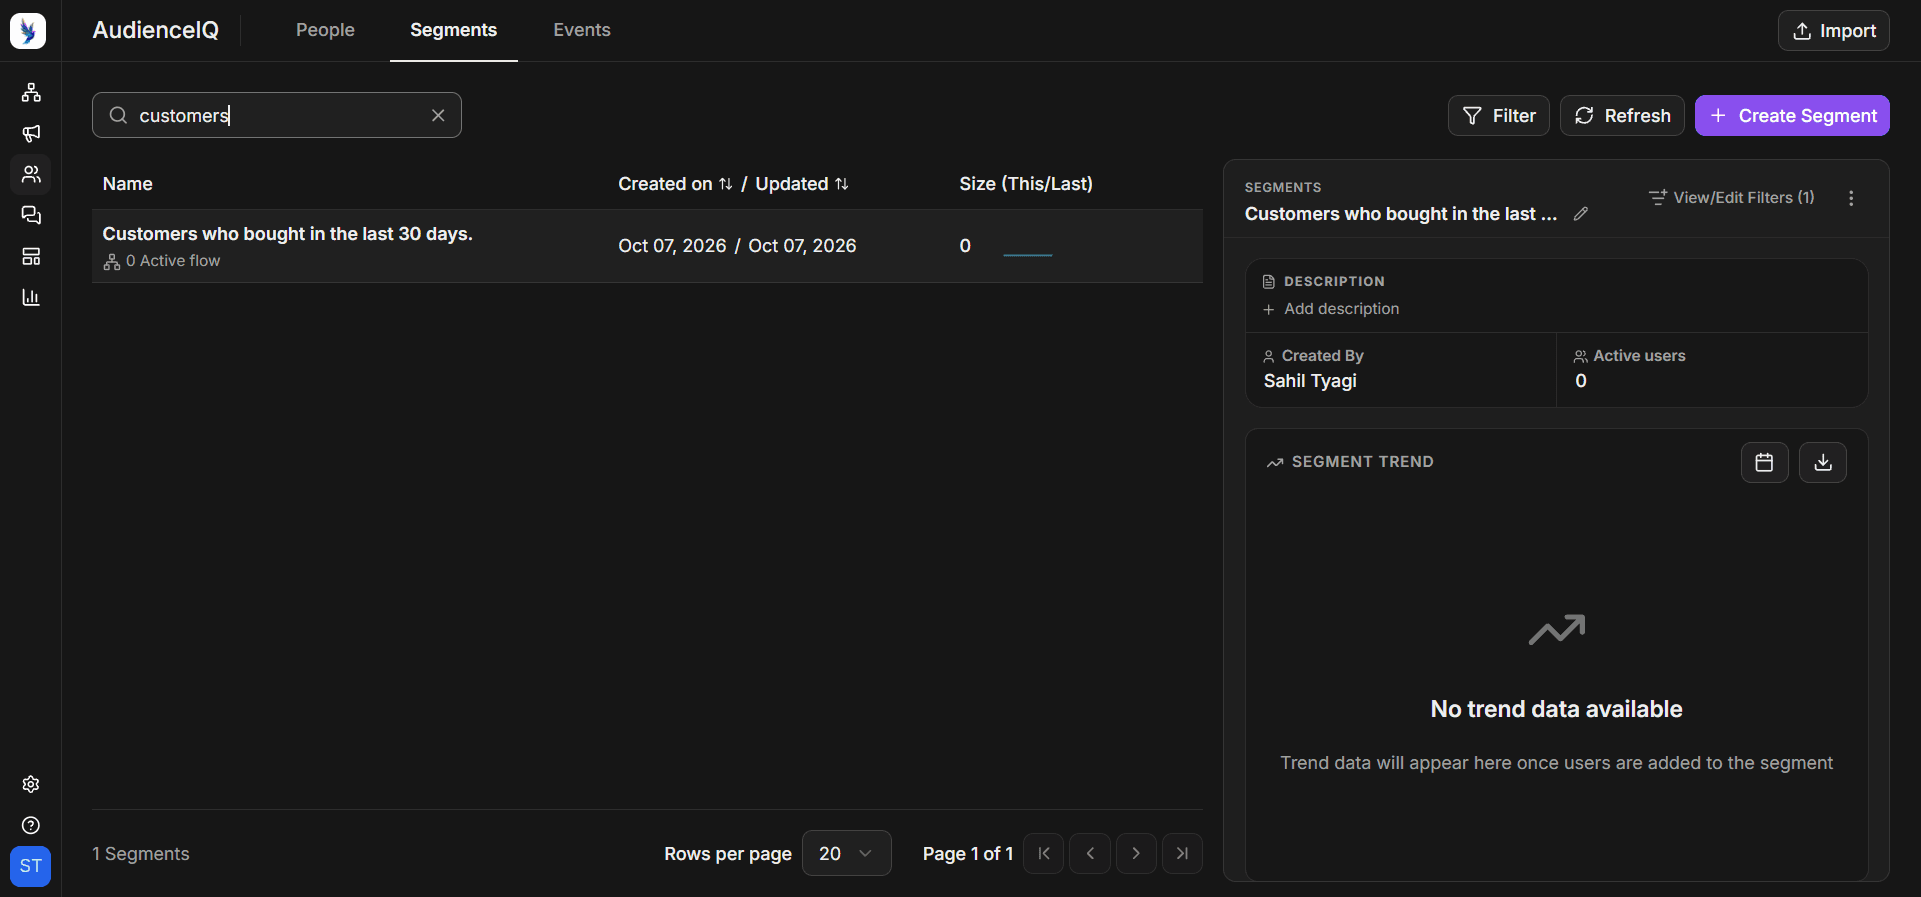
However, when you build a lookalike from your Champions segment specifically, you are asking the platform to find people who resemble your highest-value customers. That audience converts at a higher rate and has a lower CAC than a general lookalike.
For B2B customer engagement, this same principle applies to account-based targeting. Identify the behavioral characteristics of your highest-RFM accounts and use those characteristics to qualify and prioritize prospecting targets.
Build Segments using Clicks
AudienceIQ lets you create tailored segments to group look-alike audiences for easier engagement.
Build your SegmentsAutomated win-back sequences that recover at-risk revenue
The at-risk customer segments identified by RFM analysis represent predictable future revenue loss. For instance, a customer whose recency score has dropped from 4 to 2 over the past quarter is signaling disengagement before they have actually churned. Catching that signal and acting on it with a targeted win-back sequence is more effective than waiting until the customer is fully lapsed.
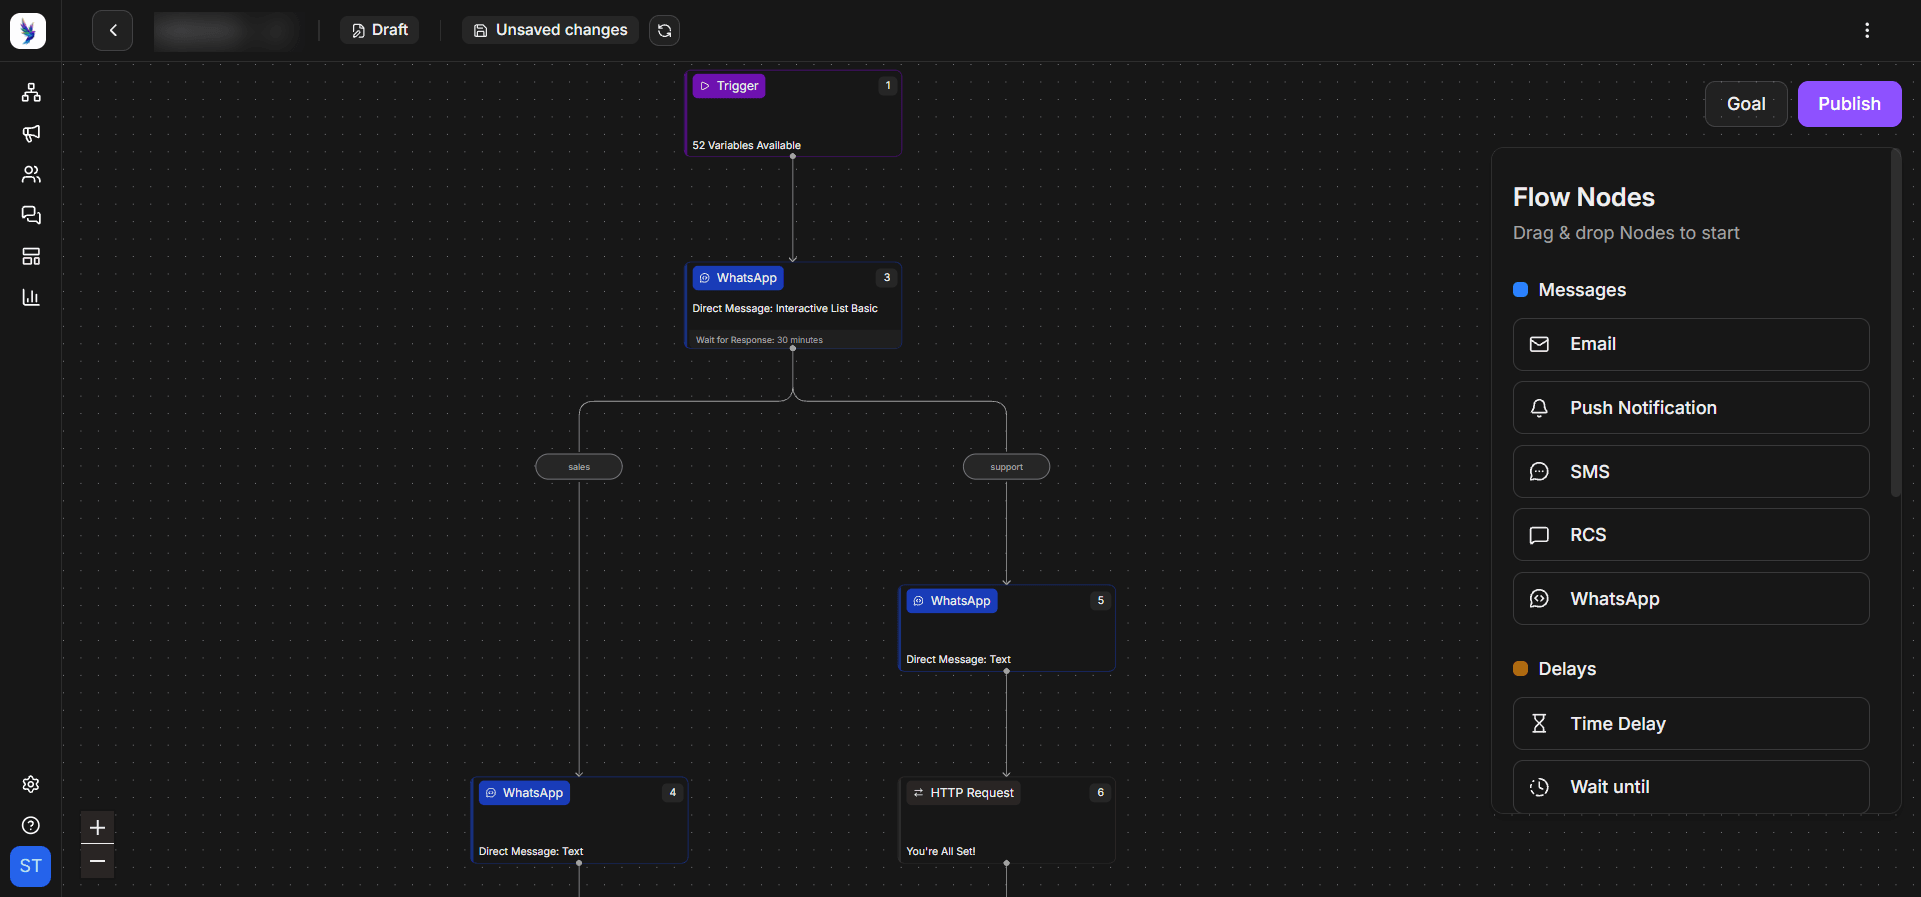
Automated win-back sequences triggered by RFM score changes recover 12 to 18% of at-risk customers. Adding a second channel to those sequences improves recovery further. Combining WhatsApp with SMS in win-back workflows lifts conversion compared to email alone. The trigger for these sequences is the RFM score itself. When a customer drops below a defined threshold, the win-back flow activates automatically.
This automation capability is what makes RFM segmentation scalable. You define the segment boundaries and the trigger conditions once, and the system identifies customers who enter the at-risk zone and initiates the appropriate sequence without manual intervention.
Understanding your customers' customer journey also helps in making these trigger points accurate because the right intervention moment varies by product category and average purchase cycle.
How to build an RFM segmentation model?
Building an RFM segmentation framework doesn't require complex workflows or a data science team. You need a transaction history, a basic analytics tool, and a clear process. Here's how to do it from scratch:
Define your data window to pull transaction history
The first decision in any RFM analysis is the time window you will measure over. This is the period of transaction history you will use to calculate each aspect for RFM. Most e-commerce brands use a 12-month window, which captures enough purchase cycles to be meaningful while excluding very old data that no longer reflects current customer behavior.
For businesses with short purchase cycles, a 6-month window may be more appropriate as it reflects current customer engagement more accurately. For businesses with long purchase cycles, like B2B software, a 24-month window may be needed to capture enough repeat purchase data to differentiate high-frequency from low-frequency customers.
The data you need for each customer record is the following:
- Customer ID
- The date of every transaction
- Value of every transaction within the window
Export this data to your e-commerce platform, but before scoring anything, remove duplicate records to ensure every transaction is attributed to a single customer identifier. Data quality at this stage determines the accuracy of every segment downstream.
Score customers on recency
Recency is calculated as the number of days between each customer's most recent purchase and the analysis date. For example, a customer who bought yesterday has a recency of 5. A customer who last bought a year ago has a recency of 1.
To assign scores, sort your customer list by recency from lowest to highest and divide it into five equal groups. The top 20%, meaning the most recent buyers, receive a Recency score of 5. The next 20% receive a score of 4, and so on down to the most lapsed customers who receive a score of 1.
This quintile-based scoring method ensures that the score thresholds are calibrated to your actual customer distribution rather than to arbitrary day counts that may not reflect your specific purchase cycle.
Score customers on frequency
Frequency is the total number of purchases each customer made within your analysis window. This is a straightforward count of distinct transactions per customer ID. Sort your customer list by frequency from highest to lowest and again divide into quintiles, assigning a Frequency score of 5 to the top 20% most frequent buyers and 1 to the bottom 20%.
One important calibration note, frequency scores are heavily influenced by your purchase cycle. A business selling coffee pods expects frequent purchases, while the business selling mattresses does not. Two purchases per year might be a high-frequency score for a mattress brand and a low-frequency score for a supplements brand.
In addition to that, for brands where a single high-value order can represent a complete customer relationship, frequency may carry less signal than recency and monetary value. In those contexts, you can weigh the three dimensions differently when combining scores, giving recency and monetary value greater influence.
Score customers on monetary value
Monetary value is the total amount spent by each customer within the analysis window. Add all transaction values per customer ID and sort from highest to lowest to assign scores. Monetary score of 5 for the top 20% spenders, 1 for the bottom 20%.
A common question at this stage is whether to use total spend or average order value. Total spend is generally the right choice for an RFM model because it captures the cumulative spend contribution of the customer to the business.
Take an example of a customer who has made 10 orders of $50 each and has contributed $500 in total. It is significantly more valuable to the business than a customer who made one order of $200, even though the second customer has a higher average order value. Total spend captures that distinction, average order value does not.
Having said that, average order value is useful as a supplementary lens when you are designing product recommendations or upsell offers. Use total spend for the RFM model and average order value for offer design. Your customer engagement measurement framework is the right place to track these downstream metrics.
Combine scores to map customers correctly
Once each customer has a Recency score, a Frequency score, and a Monetary score, combine them into an RFM score by combining the three digits.
A customer with Recency 5, Frequency 4, and Monetary 5 has an RFM score of 545. A customer with Recency 1, Frequency 1, and Monetary 2 has an RFM score of 112. The first customer is a Champion and the second is a candidate for your lapsed segment.
The standard RFM segment map assigns each score combination to a named segment based on the behavioral pattern those scores represent. Champions have high scores across all three dimensions: RFM scores of 555, 554, 545, or similar.
Loyal Customers have high frequency and monetary scores but may have slightly lower recency, like 445 or 434. Potential loyalists are newer customers with high recency who haven't yet built up frequency, such as scores around 512 or 521. At-Risk customers once had high scores but are declining on recency, like 255 or 244. Lost customers have low scores across all three dimensions.
The precise boundaries for each segment are flexible and should be calibrated to your data. Some businesses use seven segments, others use eleven. The important principle is that each segment maps to a distinct behavioral state and a distinct set of marketing actions.
Assign marketing actions to each segment
Scoring customers without acting on the segments produces no business value. The power of RFM segmentation is in the specific, differentiated actions it enables for each group. Here is the standard playbook for the most common segments:
- Champions: These customers buy recently, buy often, and spend the most. The right actions for Champions are reward and referral. Do not discount Champions unless the discount is positioned as an exclusive benefit because unnecessary discounting trains high-value customers to expect lower prices.
- Loyal Customers: These customers buy frequently and spend well but may not have purchased as recently. The right actions are product recommendations based on their purchase history, cross-sell offers for adjacent categories, and loyalty program benefits that reward their cumulative spend.
- Potential Loyalists: These are your most recent buyers who haven't yet built a pattern of repeat purchase. The right actions here are a second-purchase incentive sent within the ideal reorder window for your product category, educational content that reinforces the value of the product they bought, and a welcome sequence that introduces them to your full range.
- At-Risk Customers: These customers are disengaging. They were previously valuable but are losing recency. The right action is a targeted win-back offer with genuine urgency, delivered in the channel they have historically engaged with most.
- Hibernating and Lost Customers: Hibernating customers have not purchased in a long time and show no recent engagement. A final reactivation attempt with a high-value incentive is worth making. Lost customers with very low scores and no recent activity should be suppressed from regular campaigns to protect deliverability and avoid wasting spend.
You can automate these marketing initiatives using omnichannel customer engagement tools like Zixflow that allow you to manage your outreach from a single channel.
Building RFM segmentation in your marketing operations
RFM segmentation is one of the most practical frameworks available for turning transaction data into revenue-generating marketing decisions. The model is accessible to any business with a purchase history, regardless of team size or technical resources.
The most common mistake teams make after building their first RFM model is treating the segments as a static report rather than an operational system. The value of RFM segmentation compounds with each refresh cycle because every cycle produces better data about which actions work continuously.
Start with the two segments that have the most immediate revenue impact, Champions and At-Risk customers. Invest in the Champions segment first, then build the At-Risk win-back flow. Those two actions alone will produce a measurable return before you've built out the full segment map.
With that said, if you are looking for a platform to activate your RFM segments through WhatsApp, email, and SMS, with automation flows that trigger on segment transitions, Zixflow is the tool meant for you. You can start a free trial and connect your customer data to see your RFM segments in action within hours.
Frequently asked questions about RFM segmentation
What is RFM segmentation?
RFM segmentation is a customer analysis method that scores and groups customers based on three behavioral dimensions:
- Recency
- Frequency
- Monetary value
Each customer receives a score from 1 to 5 on each dimension based on their position relative to other customers in your database. The combined RFM score determines which behavioral segment the customer belongs to, from Champions at the top to Lost customers at the bottom.
How do you calculate RFM scores for customers?
To calculate RFM scores, pull your transaction history for a defined window and calculate three values per customer:
- Days since last purchase
- Total number of purchases
- Total spend
Sort customers on each dimension and divide them into five equal groups (quintiles). The top 20% on each dimension receives a score of 5, and the bottom 20% receives a score of 1. Concatenate the three scores to produce each customer's RFM score, such as 534 or 211.
What are the standard RFM customer segments?
The most commonly used RFM segments are:
- Champions
- Loyal Customers
- Potential Loyalists
- New Customers
- At-Risk Customers
- Hibernating Customers
- Lost Customers
The exact boundaries vary by business, and some practitioners use seven to eleven segments.
How often should I refresh my RFM segments?
For most e-commerce businesses, a monthly refresh cycle is the right cadence. Monthly is frequent enough to catch meaningful behavioral shifts. High-volume businesses with daily transaction data and short purchase cycles may refresh weekly. Businesses with long purchase cycles, such as B2B or high-ticket categories, can refresh quarterly without losing significant accuracy.
What data do I need to run RFM segmentation?
You need a transaction history with three data points per order: a customer identifier, the transaction date, and the order value. This data is available in your ecommerce platform or order management system.
What is the difference between RFM segmentation and predictive segmentation?
RFM segmentation is descriptive. It groups customers based on what they have already done. Predictive segmentation uses machine learning to forecast what customers are likely to do next.
RFM is more accessible because it requires no machine learning infrastructure and works from a basic transaction export. Predictive segmentation requires significantly more data and technical resources but can identify at-risk customers earlier.